|
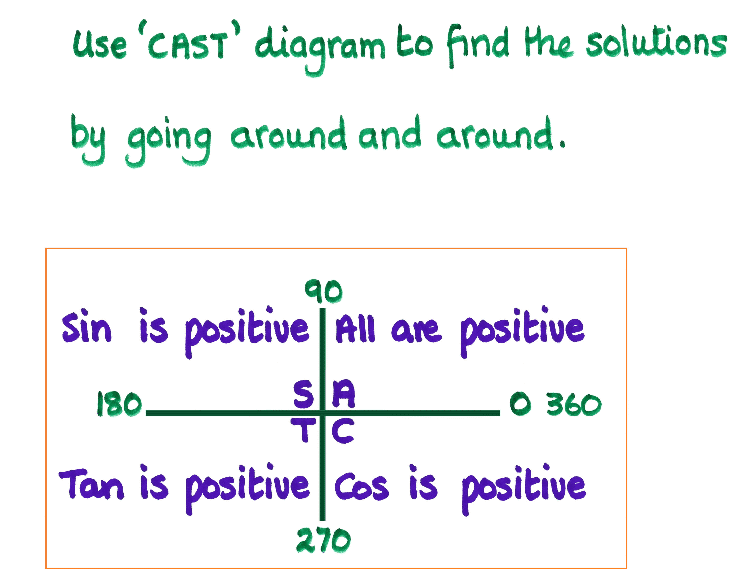
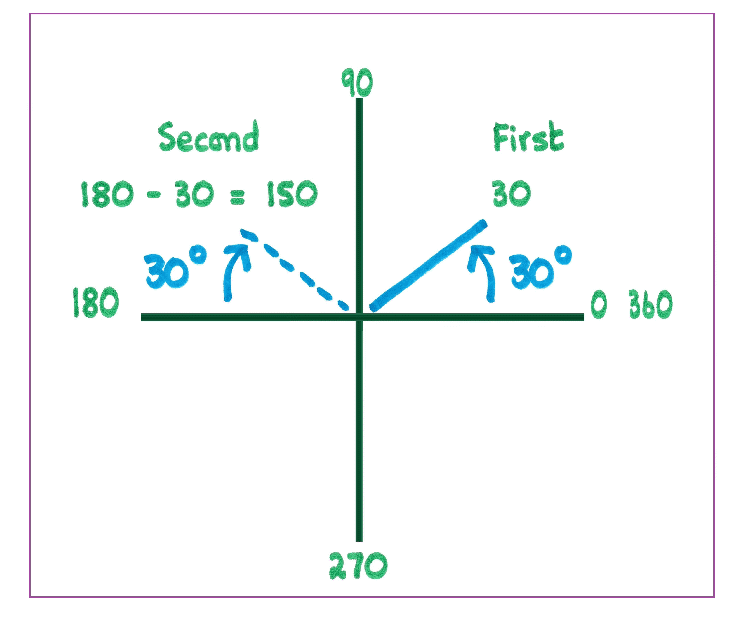
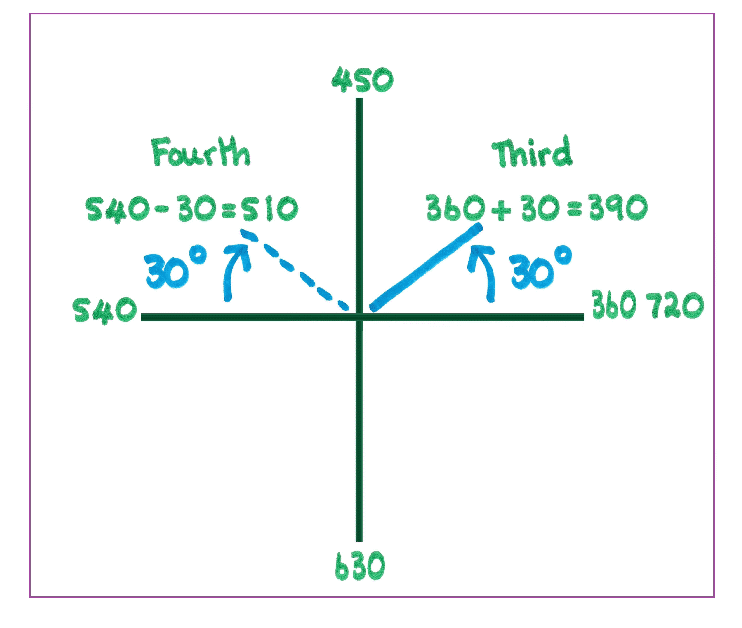
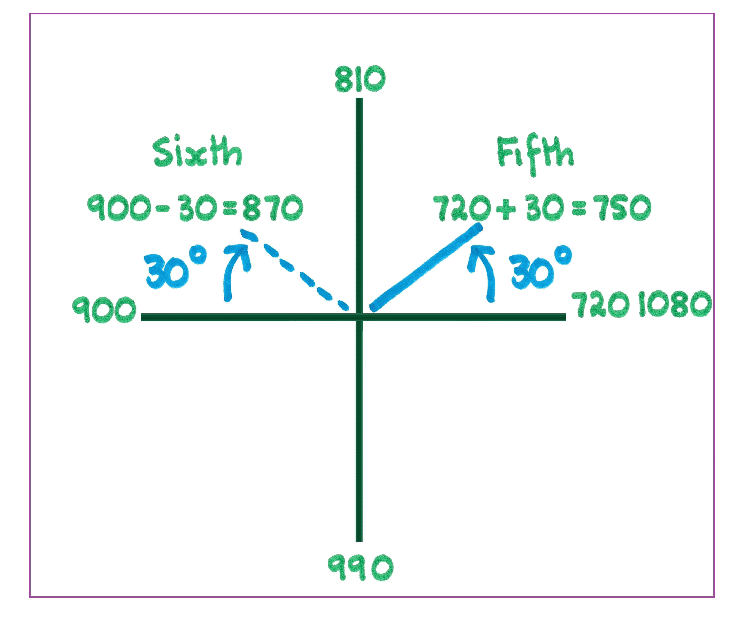
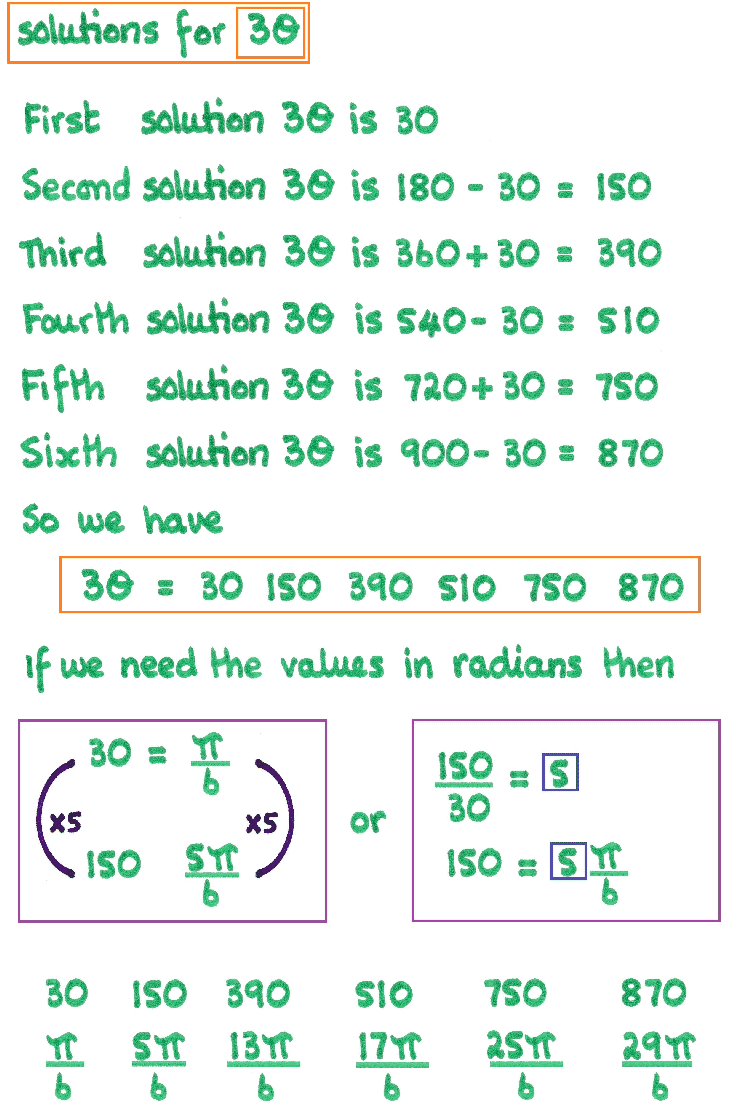
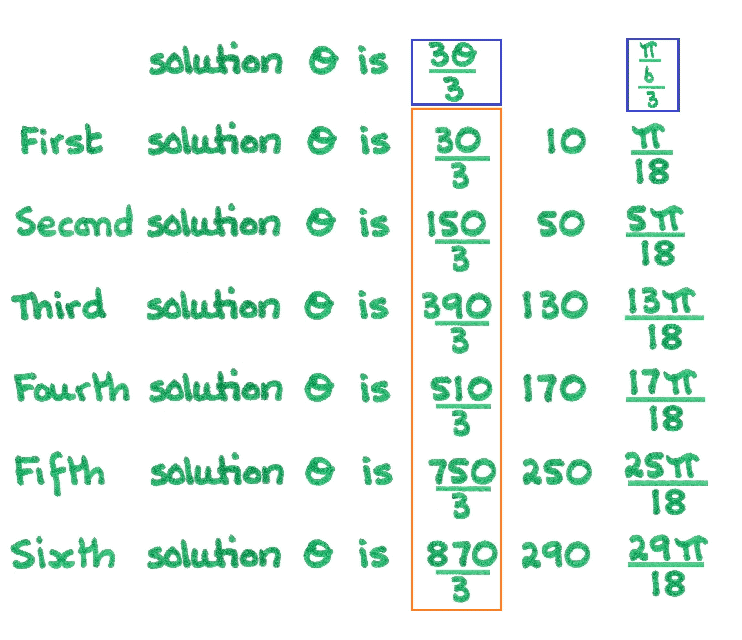
The CAST diagram is the wave diagram drawn around a spot rather than along a line. Each segment is one of the quadrants and the sign of the trigonometric function changes depending in which quadrant it lies. From the diagrams below, you will see that between 0 and 90, 360 and 450 etc all the trigonometric functions are positive. Since the number we have is + 1/2 then we only look at the quadrants which Sine is positive and simply calculate the angle as shown. You will go 3 times and as you do the angles change on the outside. Beware when the angle is negative and check which quadrants you need, if the number had been - 1/2 then the two angles needed would be in the two bottom areas from 180 to 270 and 270 to 360.
|


